Wardah Rahman and Zarin Karimi

Title: Frequented Bike Paths during the Different Hours of the Night in Summer 2023
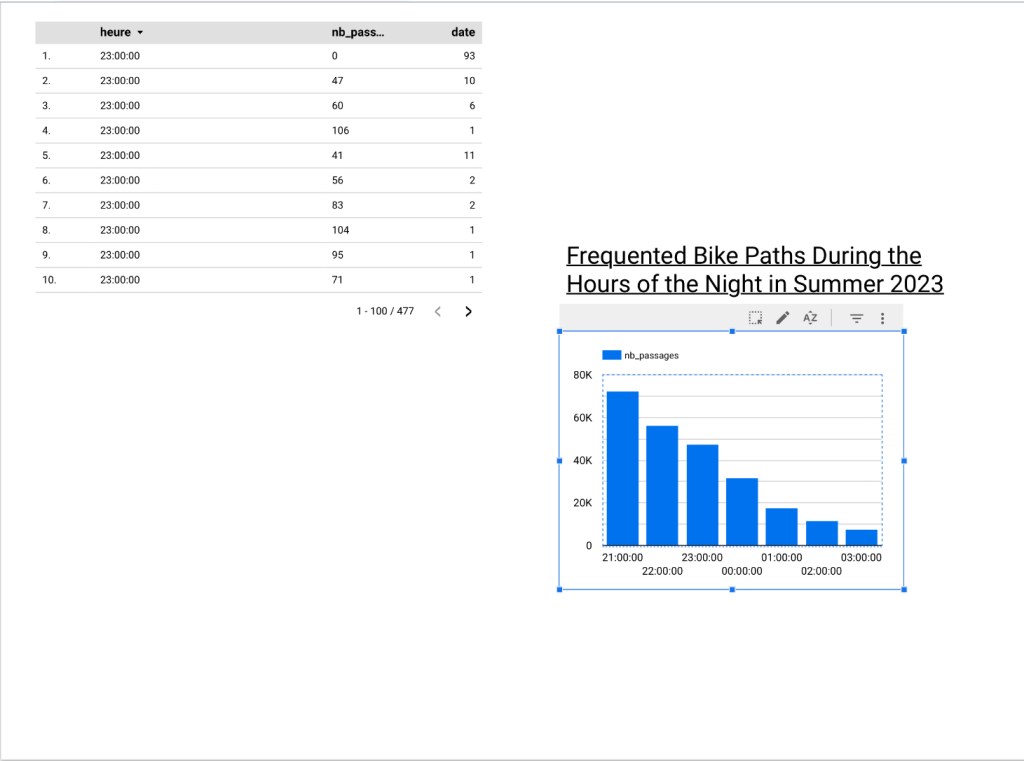
This data sculpture represents the bike paths frequented at night by the bikers during summer 2023. In order to create this sculpture, we used a data set that we filtered out in order to retrieve the information on the numbers of bike paths used starting from June 21st 2023 up until September 21st 2023 and based between the hours beginning from 9 pm (21h00 pm) until 3 am. The gradient of the wood sticks also has a significance, the darker the color is, the denser the number of bike paths used are at the specified time, and the lighter the color is, the less used they are in the middle of the night. We chose to focus on the summer season because it is when people tend to use their bikes the most since it is a lot warmer outside compared to the winter season.
—
Title: Heaviest vs Lightest bicycle traffic in Montreal in Summer vs Winter
Team members: Daniel Giove, Matthew Lepore, Kaden Phillips


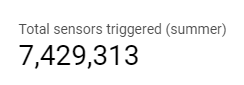
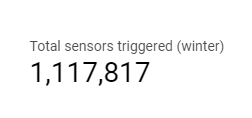
Median: Big Styrofoam balls were used to represent the sum of all sensors triggered by cyclists during the summer and winter of 2023. One is covered with grass to represent summer and the other is covered with dandelion fluff to represent snow. Smaller pieces of Styrofoam balls (or just bits of it) represents the highest and lowest days of traffic in Montreal with respect to the season it’s from. It is placed in a box diorama with the date for the smaller Styrofoam and the number of sensors triggered for everything in it. The weather for these days is also included.
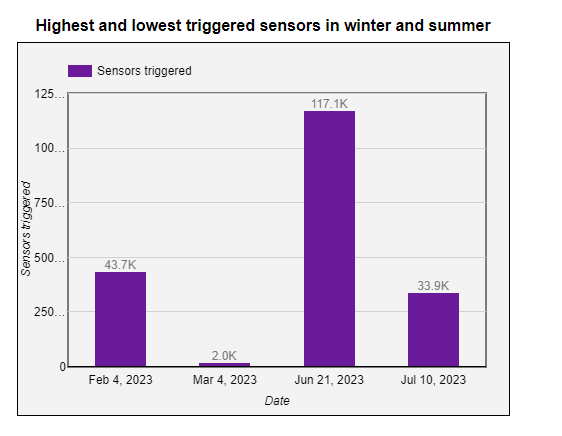
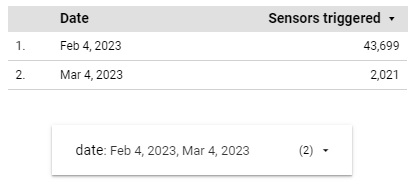
Description: We have selected to work on bikers in Montreal and try to compare the bicycle traffic in winter compared to summer. We noticed there was a clear difference in the number of biker traffic between the seasons, which shouldn’t come as a surprise. The bar graph displays the highest and lowest points of bicycle traffic with the left 2 representing winter and the right 2 representing summer. During the winter, the lowest was approximately 2k on March 4th (-2 Celsius and heavy snow) and the highest was 43.7k on February 4th (-22 Celsius and partly cloudy). During the summer, the lowest was 33.9k on July 10th (22 Celsius and light rain) and the highest was 117.1k on June 21st (25 Celsius and partly cloudy). We believe the weather plays a role in the amount of traffic, not just temperature. For example, although it was -2 on March 4th, the heavy snow was likely a huge factor as to why there was low traffic. During the summer, rain could be a factor as well. Another thing to add is that it made sense as to why June 21st was the busiest day during the summer as it was the start of the summer solstice. The favourable conditions on this day is another reason why it had the highest bicycle traffic during the summer.
Matteo Vila and Steven Polizzi
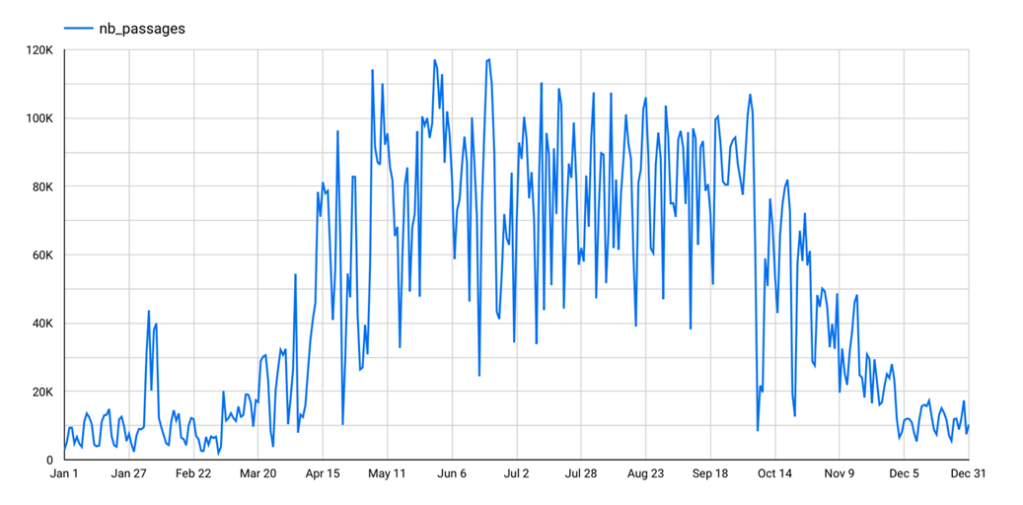
The graph above represents the number of bike riders that are using the bike paths for each day in 2023 in the city of Montreal. A piece of data that stands out in this graph is that in winter from December to March there are not as many biker riders as compared to the summer, spring, and fall from April to October. If we analyze the graph in winter, there is roughly less than 10,000 bike riders per day. On the other hand, if we look at the months in summer the data goes to a high of 115,000 bike riders in one day and can reach a low of 50,000 bike riders in one day. The day that had to the greatest number of bike riders in 2023 is May 30 with 117,140 individuals using the bike paths around Montreal. The day that had the least number of individuals using the bike paths was March 4 with 2,021 bikers. Factors such as temperature play a role in affect the number of bike riders in the winter. In winter it is usually cool so most individuals will not want to use the bikes for transportation. In the summer the temperature is a lot warmer so most people living in Montreal will want to enjoy the nice whether and take the bike for transportation. Another factor is the condition of the roads in winter it takes a lot more effort to ride a bike thought the snow as in summer the condition of the roads is clear and a lot easier for rider to ride their bikes.

We made a 3D model out of recycled cans. We made a bicycle representing the bikes through the months. The bicycle begins its route and along the road there are bumps. These bumps represent the activity during each month, starting with January and ending with December. The highest peaks are the months of May to September when it’s nice and warm outside, while the peaks in the middle between high and low are April, March and October because it is not as warm but not too cold to bike, while the lower peaks, January, February, November and December are the months where it is cold and most likely to have snow. The information we can get out of this is that the warmer months have more bikers rather than the colder months.
