… and asking questions of your data
Using AI and data search engines to find datasets that are relevant to the research question, then using datasets and WTF.csv to find further research questions to move the data story forward.
Part I
Here, you will formulate research questions and find data sets to help you answer the question. For now, we’re not going to necessarily answer the questions we ask of the data set, we’ll just learn how to find relevant datasets.
Find:
1. One question useful to your team’s topic interest.
2. The kinds of data you need to get the answer
3. How you would access those dataset(s). Use this for a running list of sources.
Example:
Topic: Saving the Amazon Rainforest.
Question: in Brazil which percentage of Amazonian land is legally protected for indigenous peoples?
Data set: This data set displays the boundaries of areas designated as indigenous lands in Brazil. Indigenous lands legally recognize indigenous peoples’ perpetual rights of access, use, withdrawal, management, and exclusion over the land and associated resources. Alienation of the land is prohibited. However, commercial use of forest resources is permitted, but cutting trees for sale requires approval by the National Legislature. Rights to subsoil resources may be obtained only with the approval of the National Legislature and after consultation with the affected indigenous peoples. This data set includes indigenous lands that are officially registered and those at various stages of the registration process.
Access the data here.
Part II
Using WTFcsv to find further research questions to move the data story forward.
Here, you will learn how to ask good questions that a spreadsheet may be able to answer. For now, we’re not necessarily going to answer the questions we ask of the data set, we’ll just learn how to think creatively about generating good research questions. You will also learn how to distinguish different types of data, and basic methods for summarizing data. Finally, you will figure out how you might answer your questions by combining your data with other data sets.
Run your dataset through WTFcsv and take a look at the output. Use the output to come up with the following:
Questions: What are the most interesting questions you want to ask the data set your are looking at? (Please list 3 questions, starting with the question that led you to your initial data set).
Other data needed: For each of your questions, determine if you need any other data sets to answer them. Name the kind of data sets required.
Sources for that other data: you need to determine if the other data sets needed exist, and if so, you need to reference them in the same way that you referenced your previous data sets.
Example:

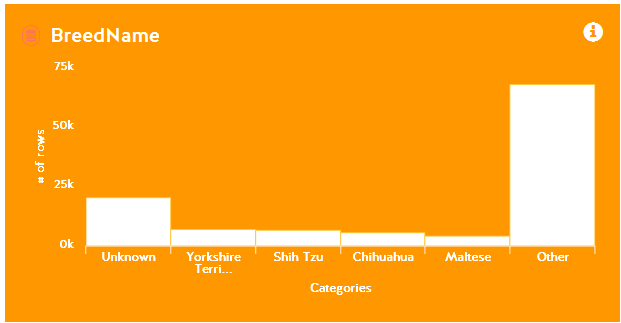
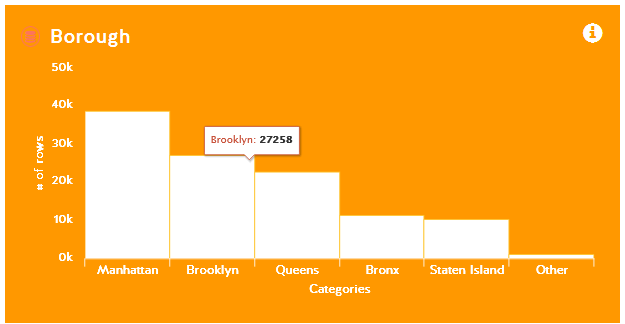
QUESTION
Are certain breeds more common to certain boroughs than others?
Are there different life expectancy for dogs in different boroughs?
Is NYC a cat or dog city (2015)?
Is New York city more of a dog city compared to Jersey city (per capita, 2015)?
OTHER DATA WE NEED
Breeds from boroughs: No other data needed.
Life expectancy by borough: No other data needed.
NYC cat or dog city: Dataset of registered cats in NYC (2015)
NYC vs. Jersey city: Dataset of registered dogs in Jersey city (per capita, 2015)
SOURCES FOR THAT OTHER DATA
Breeds from boroughs: n/a
Life expectancy by borough: n/a
Registered cats in NYC (2015): ask the New York City Housing authority
Registered dogs in Jersey city: use this and scrape the data.
Philippe Beluet-Dutescu
PART 1
Topic: Spring and death
Question: How many people die during spring in Canada? [VG1]
Data Set: Deaths by Month
Description: This dataset provided by Statistics Canada displays the number of deaths that occurred in Canada each year and month, stretching all the way back 1991. You can also adjust the dataset to include either Canada as a whole or provinces individually.
In this dataset, each year is represented as a collum and each month a row.
File Type: .csv
Size: 10.12kB (Can vary based on data parameters and selections)
Topic: Spring and Birth
Question: How many babies are born during spring in Canada?[VG2]
Dataset: Live Births by Month
Description: This dataset provided by Statistics Canada displays the number of live births that occurred in Canada each year and month, stretching all the way back to 1991. You can also convert the individual number of births each month into percentages that represent how big or small a month’s live birth rate may have been on a yearly scale.
In this dataset, each year is represented as a collum and each month a row.
File Type: .csv
Size: 5.61kB (Can vary based on data parameters and selections)
Topic: Spring and GDP
Question: How does spring affect Canada’s GDP?
Dataset: GDP Per Month and Changes in GDP %
Description: This dataset provided by Statistics Canada displays the GDP of Canada in any month while also comparing this number to the previous years number displaying a shift in GDP via a %.
In this dataset, the rows are classified into different industries that make up Canada’s GDP based on the North American Industry Classification System (NAICS). Each month is represented as a collum.
File Type: .csv
Size: 4.63kB (Can vary based on data parameters and selections)
[VG1]A better question would be: how many people die during Spring in Canada as compared to the other seasons?
Roughly what percentage of Canadians die in the Spring as opposed to the other seasons?
Does it vary depending on the year?
[VG2]A better question would be: how many people are born during Spring in Canada as compared to the other seasons?
Roughly what percentage of Canadians are born in the Spring as opposed to the other seasons?
Does it vary depending on the year?
Part 2
Questions: Deaths In Canada
- How did these people die?
- Which season is the deadliest?[VG1]
- How old were they
Other Data Needed:
- Data on a city-to-city basis [VG2]
- Data of age statistics and numbers in Canada and there % makeup of the overall population
Sources for that other data:
- Data of age statistics and numbers in Canada and there % makeup of the overall population
https://open.canada.ca/data/en/dataset/b5bf245a-e365-4201-862c-57c74402358e
Questions: Live Births in Canada
- Where were these babies born?[VG4]
- Which season produces the most live birth[VG5] s?
- What gender are these babies?[VG6]
Other Data Needed:
- Data on location of births on a province-to-province basis
- Data on gender mix of babies in Canada
Sources for that other data:
- Data on gender mix of babies in Canada
https://open.canada.ca/data/dataset/3e28cce2-c913-4842-b124-b56b2d2ecb14
- Data on location of births on a province-to-province basis
https://open.canada.ca/data/dataset/25c5615b-d8dc-4997-aa14-36075ff37ea6
Questions: GDP Canada
- Which industries contribute the most to the GDP
- Which month sees the biggest shift in GDP either increase or decrease
- Which industries contribute least to the GDP[VG7]
Other data Needed: N/A
[VG1]This question was answered already in part 1.
[VG2]You don’t need specifically city-to-city data on how people died. You just need the data on how they died.
[VG3]This isn’t the data that you need.
[VG4]Better question: which part of canada has the most births, where the population is growing the fastest?
[VG5]This question was already answered in part 1.
[VG6]OK
[VG7]OK
Karen Katsampas
Brianna Lento
Topic: The effects of noise exposure on our well-being
Part 1:
Questions:
Dataset #1: What psychological components of the human being are being targeted when distressed due to noise exposure?
Description: This dataset contains real-time behavioral and physiological data collected from college students to monitor their engagement, attention, emotional states, and overall well-being in a classroom setting. The data is gathered using a combination of IoT sensors and wearable technology that capture various metrics such as student attendance, facial expressions, posture, movement, heart rate, skin temperature, and breathing rate. Classroom conditions like noise levels and lighting are also included to provide a comprehensive view of the learning environment.
In this data set, they focus on the person’s breathing rate, heart rate, skin temperature, facial expression, interaction level and posture. This shows what is being affected when someone is exposed to high noise levels. It helps to better understand how each person reacts to different noise levels and figure out what really triggers them to be able to maintain their well being.[VG1]
https://www.kaggle.com/datasets/ziya07/student-behavior-monitoring-dataset
Dataset #2: How does noise pollution impact our well being?[VG2]
Description: The NOISE Project Centers equity in the fight against noise pollution. Their goal is to explore noise impacts on personal and community wellbeing and connect people to safe and healthy sound environments while acknowledging the ties between environmental justice, historical systemic oppression, and racial justice work.
In the dataset, it shows where the noises are taking place, such as new york, los angeles, chicago etc., the start time and day, the duration of the noise, how people’s moods are affected, etc. This shows the impact that noise pollution has on individuals daily in busy cities.
Dataset #3: How can noise exposure affect our ability to focus?
Description: This dataset is designed for emotional monitoring and feedback systems, specifically tailored for university ideological and political education using biosensor technology. It aims to simulate the physiological and behavioral responses of students to track their engagement levels in educational environments.
In this dataset, what is being shown is the psychological focus in a student, such as emotional state, heart rate, cognitive state, etc, when in school conditions, like high noise levels. This can interrupt their ability to stay focused and shows how certain noise exposure can affect the way we are engaged. [VG3]
https://www.kaggle.com/datasets/ziya07/emotional-monitoring-dataset/data
[VG1]Good
[VG2]A more accurate question would be: how does noise pollution impact our mood.
[VG3]Good
Part 2 (using wtfcsv):
Dataset #1:
https://www.databasic.io/en/wtfcsv/results/67e20807ba9bed82a7168d77?submit=true
Questions:
1.Does student behavior change based on the time of day?
No other data needed
2. How does a student’s posture relate to their engagement level in the classroom?No other data needed
3. Is there any correlation between a student’s attendance and their heart rate or facial expressions?
No other data needed[VG1]
Dataset #2: https://www.databasic.io/en/wtfcsv/results/67e34e60ba9bed82af507bf0?submit=true
Questions:
- How does the mean volume (dBA) vary with location (latitude and longitude)?
No other data needed
- Is there a correlation between the time of day (UTC) and the observed noise levels?
No other data needed
- How does the noise level differ between the various time zones in the dataset?
No other data needed[VG2]
Dataset # 3: https://www.databasic.io/en/wtfcsv/results/67e35741ba9bed8c093a8e18?submit=true
Questions:
- How do heart rate and skin conductance levels relate to each other in this dataset?
No other data needed
- What is the relationship between pupil diameter and smile intensity in the dataset?
No other data needed
- Do changes in pupil diameter correspond with emotional changes, such as increased stress?
No other data needed[VG3]
[VG1]Good
[VG2]Good
[VG3]Good.
Viet-Ty Nguyen
Julio Cesar Ramos Vargas
Micah Shiffman
Florence Toews
Topic: The impact of noise pollution and meditation on our inner peace and mental health[VG1]
Question: How does the decibel level in urban areas correlate with the happiness score of a city’s population?
Data set: Happiness index 2024
Description: This dataset aims to analyze and understand the relationship between various urban factors and the happiness of a city’s population. It includes crucial features and measurements from various cities around the world, focusing on factors that may affect the overall happiness score of each city like the decibel level, traffic density, green space area, air quality index, happiness score, cost of living index, and health care index.
File type: csv (train.csv) Size: 27,22 kB
Link: https://www.kaggle.com/datasets/emirhanai/city-happiness-index-2024
Question: Are communities affected by noise pollution and are there noise complaints?[VG2]
Data set: Aircraft noise complaints
Description: This dataset contains counts of aircraft noise complaints by community and by month between 2005 and 2019. The data is used to understand the community’s aircraft noise concerns, to collaborate with stakeholders in an effort to reduce and manage aircraft noise. The columns include the year, month, community, total complaints and total number of callers.[VG3]
File type: csv Size: 112,84 kB
Link: https://www.kaggle.com/datasets/vivovinco/aircraft-noise-complaints
Question: How do lifestyle factors like noise exposure and meditation habits influence the likelihood of experiencing overstimulation?
Data set: Overstimulation behavior and lifestyle dataset
Description: This dataset is a synthetic dataset designed to predict the likelihood of individuals experiencing overstimulation based on various lifestyle and behavioral factors. It includes data from 2000 individuals and is structured with 20 columns of environmental factors such as age, sleep hours, screen time, stress level, noise exposure, social interaction, work hours, exercise hours, caffeine intake, multitasking habit, anxiety score, depression score, sensory sensitivity, meditation habit, overthinking score, irritability score, headache frequency, sleep quality, tech usage hours, and a binary target variable indicating whether an individual is experiencing overstimulation.[VG4]
File type: csv Size: 213,75 kB
Link: https://www.kaggle.com/datasets/miadul/overstimulation-behavior-and-lifestyle-dataset
[VG1]You can only establish correlation, not causation with this, but it’s good.
[VG2]This question needs to be better thought out. What do you mean? If people are complaining, this means that the community is affected.
[VG3]OK
[VG4]Good
Questions:
- Does noise pollution significantly impact the happiness score of cities?[VG1]
- Other datasets needed: population density data
- Is there a correlation between traffic density and the decibel level?[VG2]
- Other datasets needed: no
- Is there a correlation between green space area and the decibel level, and does this affect the happiness scores?[VG3]
- Other datasets needed: no
Questions:
- Has the volume of aircraft noise complaints increased or decreased over time, and are there any seasonal patterns?[VG1]
- Other datasets needed: no
- Is there a relationship between the number of unique callers and the total number of complaints?[VG2]
- Other datasets needed: no
- Do certain communities consistently report higher numbers of complaints, and if so, are there common factors (ex: proximity to airports)?[VG3]
- Other datasets needed: no
[VG1]OK
[VG3]You need to specify the common factor that you want to explore.
Keira Vallera
Vlad-Andrei Voica
Topic: Coffee preference in Canada
Question: Where does most Canadian coffee come from?
Dataset: https://www.statista.com/statistics/1056714/coffee-type-preference-canada/
Description: UN Comtrade published a dataset in 2024 showing how much money Canada spent on coffee imports from each country, indicating which country of origin is the most popular among Canadian coffee consumers
Size: 92 kb
Topic: Coffee consumption in Canada
Question: How much coffee do Canadians consume? Dataset I: https://www.statista.com/statistics/452671/number-of-cups-of-coffee-consumed-per-day-among-coffee-drinkers-canada/
Description: the Coffee Association of Canada presents a dataset that shows the trends in coffee consumption among Canadians from 2008 to 2022
Size: 63 kb Dataset II: https://www.statista.com/statistics/448852/coffee-consumption-canada/
Description: this dataset, published by USDA Foreign Agricultural Service, shows the amount of coffee consumed by Canadians from 2010 to 2023. The values represent the number of million 60-kilogram bags, so, for example, in 2014/15 Canadians consumed 4.5 million 60-killiogram bags of coffee. This equivalates to 270 million kilograms of coffee.
Size: 69 kb
Topic: Coffee pricing in Canada
Question: How much does coffee cost in Canada?
Dataset: https://www.statista.com/statistics/444004/average-retail-price-for-roasted-coffee-in-canada/
Description: StatCan shows the average retail price for roasted coffee in Canada from January 2019 to September 2024
Size: 114 kb
