Write a post on the class blog about a data presentation on the environment that you saw recently (250ish words). Include a link and a picture/screenshot of the presentation.
Make sure to address:
•what data is being shown
•who you think the audience is
•what you think the goals of the data presentation are
•whether you think it is effective or not and why
Example:

Global temperature between 1815 and 2018. Blue is cold, red is hot. Arrows appear every time it is a new warmest year.
* This data is being shown to educate the public about rising global temperatures.
* The audience are reddit users and the general public. |
* The goal of the data presentation is to visually represent changing temperatures over the past 180 years.
* It is pretty effective, but it could be better if it also indicated when different carbon dioxide emitting industries came into being, and when big incidents happened in the world that compromised our ability to clean the air of carbon dioxide (ie. rainforest destruction ) to establish a correlation.
Need inspiration? Take a look at how a class at MIT handled a similar assignment here and here.
Philippe Beluet-Dutescu
Karen Katsampas
Brianna Lento

https://ourworldindata.org/plastic-pollution
The data being shown presents the increase of plastic production in the world measured in million tons from 1950 to 2019. The production of plastic is shown to be raised to almost 500 million tons by 2019. This growth shows the expanding production of plastic products in modern society, which can cause issues, like pollution and waste in our environment. I believe the target audience is the general public and environmental organizations. I think the goal of the data being shown is to alert the general public on how much plastic production is increasing which can harm the world we live in and can come up with strategies to prevent this, such as not buying plastic products and instead replace it with paper products (straws, utensils, bags, etc). Environmental organizations, like the GreenPeace organization, are also meant to be aware and help promote the reduction of single plastic use and encourage recycling, as well as finding other sustainable alternatives.They should promote their organization more publicly, like billboards, posters, social media, etc, so that a majority of people are aware of the situation before it becomes more threatening to the world. This graph is pretty effective considering how simple it is to read and understand the issue, but I feel like there should be more information added, like specific countries and what plastic products are being produced the most. This may help people understand which countries are more at risk, which can possibly be their own country and what plastic products to avoid.
Viet-Thy Nguyen
Death rate from air pollution from 1990 to 2021,
https://ourworldindata.org/air-pollution
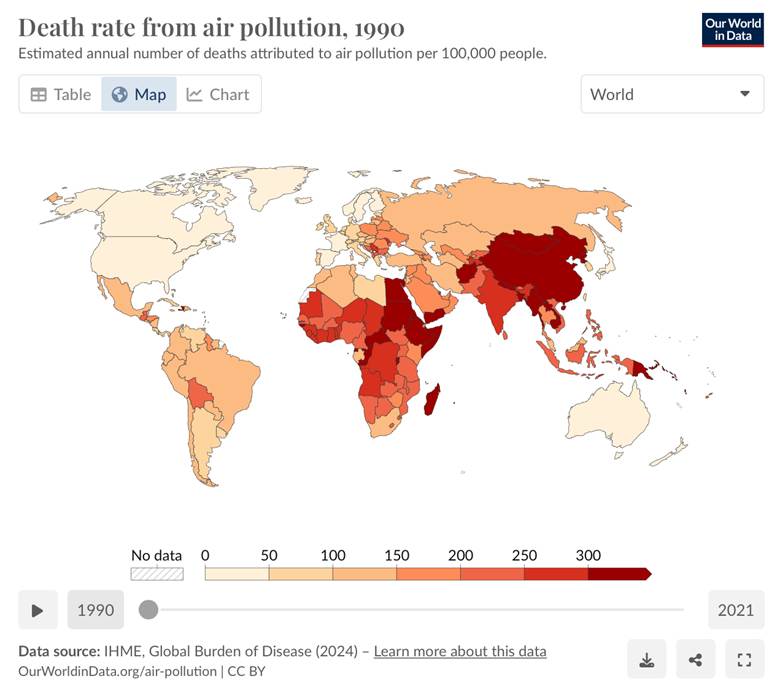
In this graphic, the data presentation shows the death rate from air pollution from 1990 to 2021. The colour beige represents zero deaths recorded in 1991 and the redder the country is, the more death has occurred due to air pollution. The data stopped after 400,000 people died due to air pollution. This data is being shown to educate how nefastus is the pollution of air in the human’s body, thus, as a citizen, everyone should continue to improve the use of indoor pollutants such as to stop using solid fuels which are used for cooking food.
Additionally, the article’s audience are the environmentalists and the general public because this data presentation had been used in a website created by credited experts of Our World in Data. Thus, people who are interested about pollution or even to understand how air pollution can affect people’s daily life are usually the ones to read this article. The goal of this data presentation is to visually represent the changing air pollution which includes the indoor and outdoor ones over the past 30 years. In the data, it illustrates that from 1990 and 2021, the population had been involved in a way that there is less death, which shows that the population had changed their habits to ensure there is less air pollution either outdoors and indoors. In short, this data presentation adequately represents the impact of air pollution on humans and makes citizens aware of its danger.
Julio César Ramos Vargas
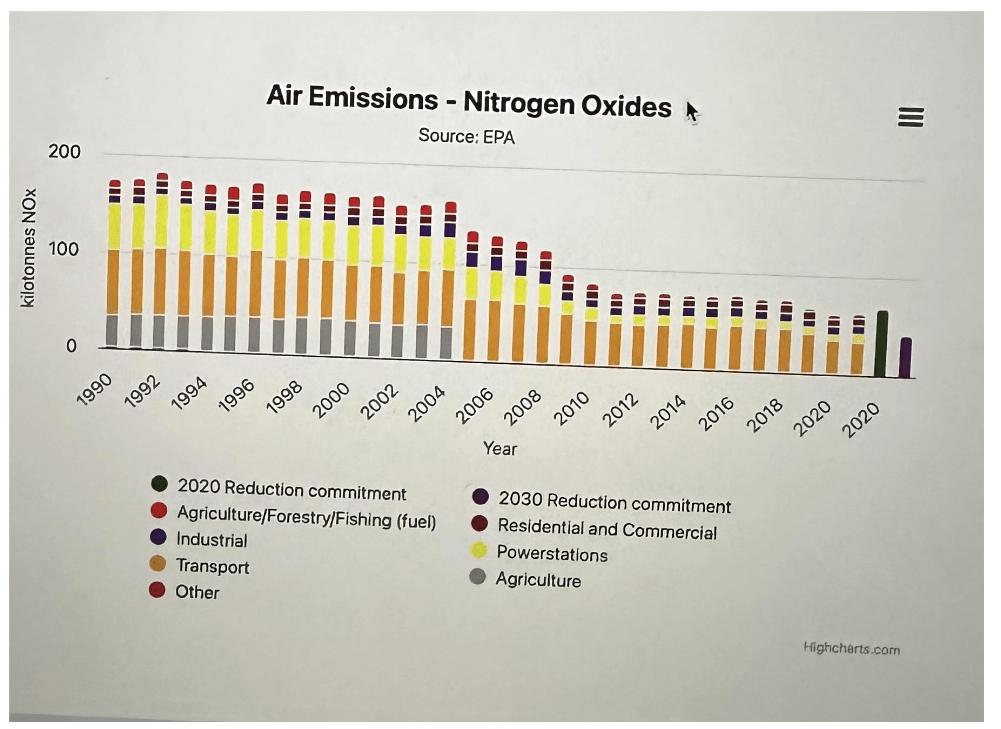
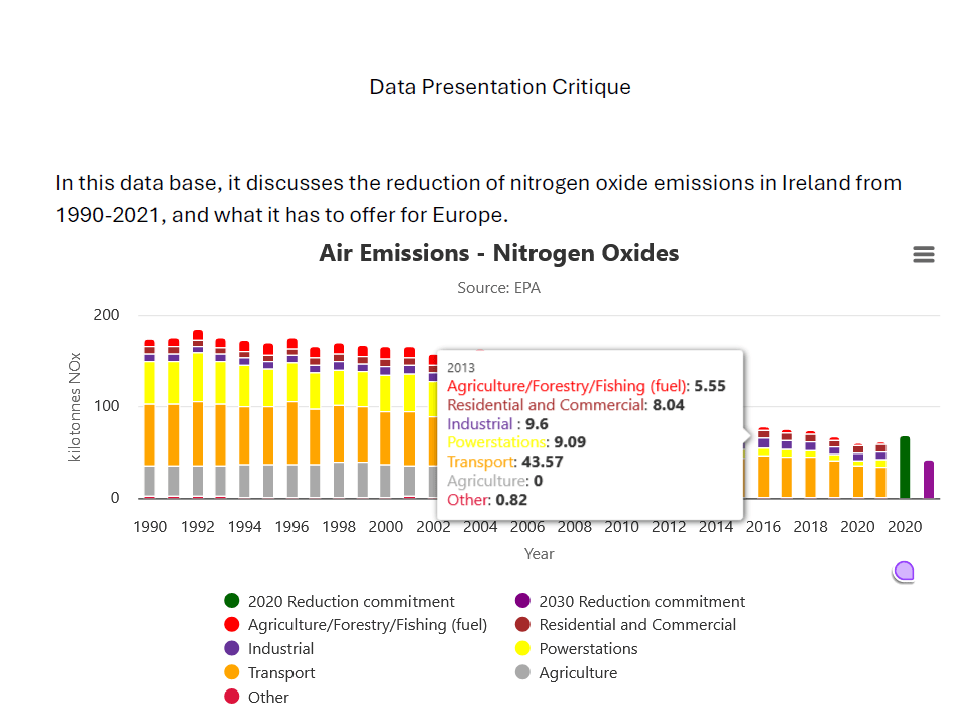
https://www.epa.ie/resources/charts–data/air/air-emissions—nitrogen-oxides.php
This data presentation is about carbon emissions, more specifically, Nitrogen Oxide (NOx). The
different colours represent the largest Nitrogen Oxide producers, the larger the colour the more they are using. The data highlights Ireland’s progress of attempting to reduce nitrogen oxides emissions under the NECD. The article shows a 53.8% reduction in NOx emissions between 2005 and 2021, which was more than the original target in 2020 of 49%. The report also sets a new goal of a 69% reduction of emissions by 2030 and mentions that according to Article 4(3) of Directive (EU) 2016/2284 emissions from manure management and agricultural soils are not included. This data presentation is aimed at policymakers and the general public who are interested in Ireland’s
environmental health. The goal of the data presentation is to show how transparent Ireland was with their willingness to be on board with global affairs involving saving the environment as possible, which not only shows the progress made, but also new set expectations/goals for future reductions. The data is clear and specific, however, the presentation doesn’t exactly go into the specific strategies or policies that are contributing to the reductions , or even outlines how exactly Ireland plans to meet its big goal in 2030, which could have inspired more confidence in the audience to take action based on the types of approaches the government is taking to complete those goals. Furthermore, even if we consider these cons, the way the Irish government follows environmental rules, regulations, and their overall progress, proves and highlights their transparency and their efforts towards reducing emissions released in ireland. To improve its impact, the presentation could have added more details about ongoing and future plans.
Florence Toews
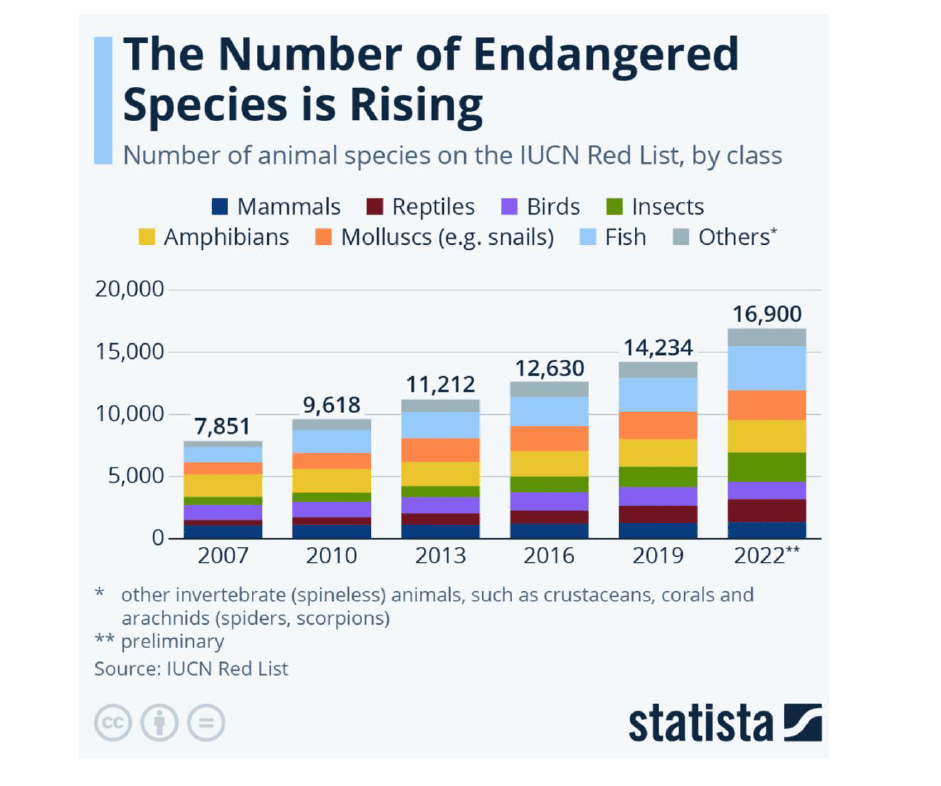
This chart shows the increasing number of species classified as threatened be the IUCN (International Union for Conservation of Nature) in the last couple years.
The website Statista is for anyone who is interested in all sorts of statistics. I think the audience for the data presentation could be for environmental researchers, educators or professionals looking for reliable statistical data. I also believe the data is being shown to bring awareness and educate people about the reality of endangered wildlife and how quickly it is becoming a major problem.
As you can see in the chart, every year is represented by a column. The length of these columns represents the number of animal species on the IUCN red list. Within these columns, you can see stripes of color where each color represents an animal category such as mammals, reptiles, birds, etc.
I think the goal of the data presentation is to show how quickly the number of endangered species is increasing, to inform people about the most vulnerable animal populations, and to highlight trends throughout the years. For example, in 2022 the number of endangered species more than doubled since 2007 and we can see that fish are in greater danger than other species.
I find this chart effective because it shows clearly the upward trend in endangered species and specifies the category. It could be better if it indicated context such as factors contributing to those increasing numbers like pollution, climate change, habitat loss, etc. This would help us clearly establish a link between the causes and the effects on wildlife.
https://www.statista.com/chart/17122/number-of-threatened-species-red-list/
Kiera Vallera
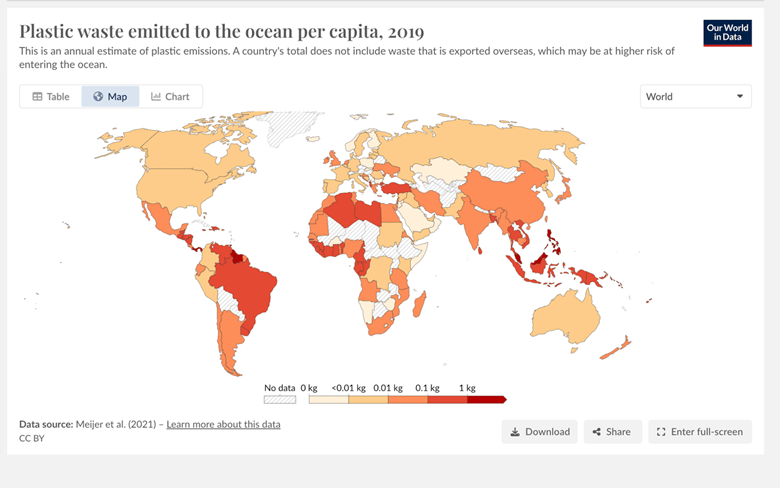
Annual estimate of plastic waste emissions per capita in 2019. The lighter the color is in that region fewer emissions of plastic waste, the darker the color is the more emissions of plastic waste in that region.
This data presentation is being shown to allow individuals to understand the annual estimate of plastic waste that gets emitted into our oceans. This presentation shows data from specifically the year of 2019 and waste was emitted per capita.
The audience for this data presentation I would say, would be the general population but as well any researchers that are looking at plastic waste or pollution in our waters and corporations or industry leaders.
I think the goal for this presentation is to visually show individuals as well as researchers and big industry cooperation’s the how much waste there is in our regions and how it does affect our society.
I do think that this presentation is effective for those who are already doing research on this subject and topic. Although, to educate the general population about this issue I do think there can be better ways to educate them like including more facts like how its grown over the years, or how much it impacts our oceans and capitals.
Vlad-Andrei Voica
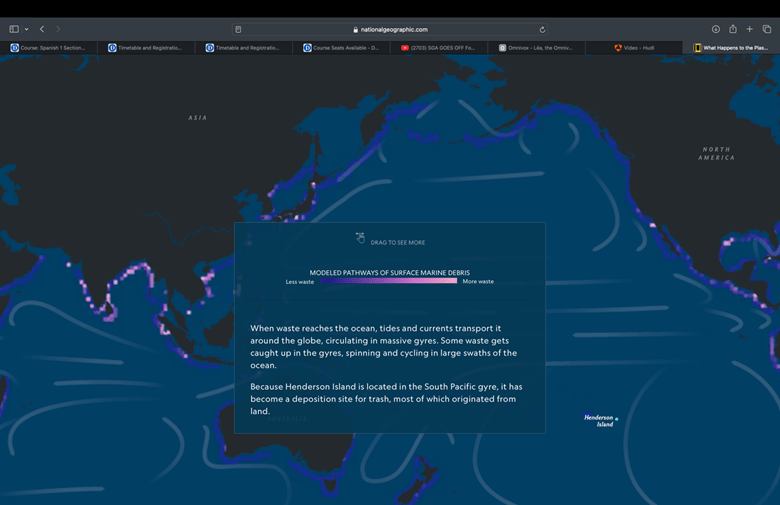
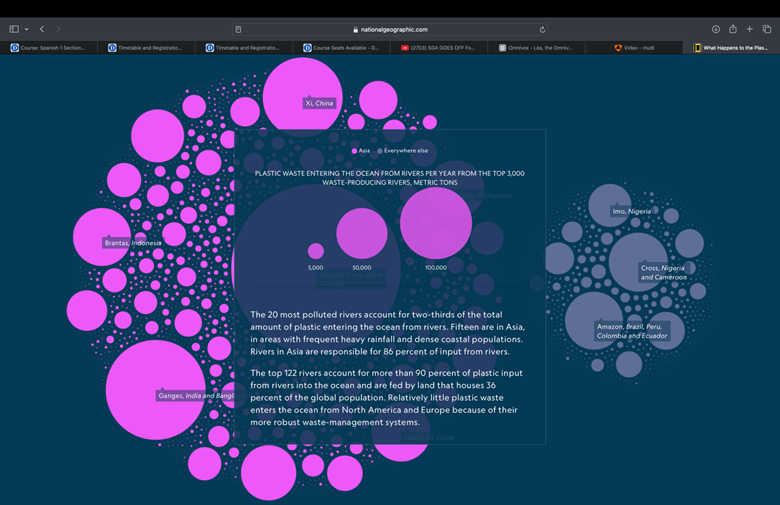
This visual presentation created by National Geographic shows what happens to the plastic we throw out, focusing specifically on how a piece of trash reaches Henderson Island, a small remote island located in the middle of the Pacific Ocean that has “the highest concentration of debris of any place in the world” (National Geographic, 2015). While showing the journey of how this happens, the presentation also illustrates other key pieces of evidence related to plastic pollution with multiple graphics, such as the amount of plastic entering the ocean from the top waste-producing rivers, or the tons of mismanaged municipal waste around the world. The audience of this presentation has a wide range, from people who are subscribed to National Geographic’s newsletter to people who are interested in the environment or climate change, or even curious college students who have to do an assignment to do, like myself. The goal of this data presentation is to raise awareness about the plastic pollution crisis around the world and show the direct causes and consequences of it through a series of graphic component which are more appealing than simple data on a paper. The way the data is showcased, which uses the direct engagement of the audience and interactive, simple graphs, makes this presentation very effective in expressing its points. I felt like the way this presentation way structured made it really easy to read and understand and the visual components attached to it were very appealing and simple, making the overall presentation of the data very effective.
James Wakefield
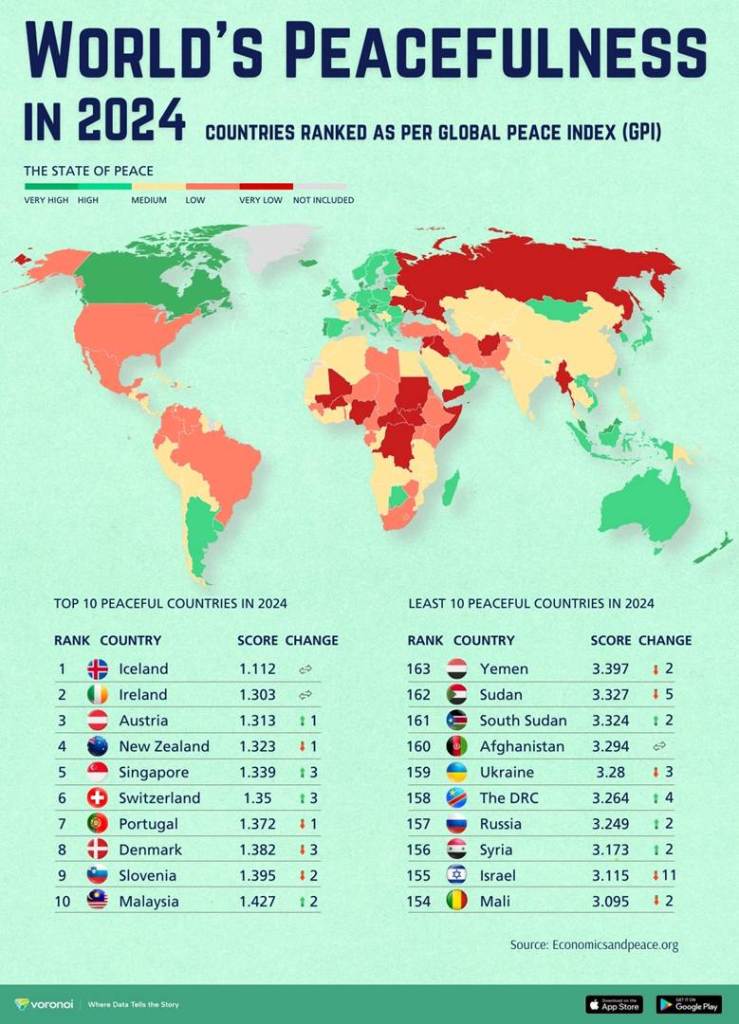
What data is being shown
The data being shown above is a world map with every country being painted a certain color depending on their ranking on the global peace index (GPI). The red and orange countries are the least peaceful and the green ones are the most peaceful. It also shows the top 10 most peaceful and the top 10 least peaceful countries with Iceland being the most peaceful and Yemen being a place I’m not sure I would like to visit.
Who you think the audience is
Anybody that wants to learn which country is peaceful and the general public.
What you think the goals of the data presentation are
For people to make an easy distinction between “good” and “bad” countries and to see whether the country they live in is safe or not.
Whether you think it is effective or not and why
I believe that the map is relatively effective at showing which countries are peaceful and which are not but some might say that whether a country is peaceful or not could be a subjective take. An example could be the United States where depending on where a person is coming from could lead to entirely different outcomes/stories, i.e.: If a Canadian is going to the United States, there should be no problem but in comparison, if a Cuban is trying to get to the US, it might not be as smooth.
